Pages

Monday, September 30, 2013

Testing Malware Scenarios in your Environment Derbycon 2013

Derbycon 3 / 2013 presentation 


Thanks to Adrian Crenshaw @irongeek_adc for getting this video posted so quick.
Reference to the rest of the Derbycon Videos. 

Details and references from slides listed below. 


Tony's twitter : https://twitter.com/Myne_us


Juan's twitter : https://twitter.com/kongo_86


We often perform pentests, vulnerability assessments, social engineering tests, and physical security but these test all miss 1 major form of attack, malware. The concept here is to introduce a different sort of test than we normally do right now.


So what is the difference between testing malware and doing something like a pentest? Some of the primary items are listed here.

--Persistence : most pentests deal with getting in and getting out and not persisting on a network. Malware more often than not will try to stick around to gather more data, propagate, or just lend itself to resources of the attacker.

--Kernel level attacks : A large portion of tests do not deal with planting itself into the kernel. Most pentests exist in memory which lends itself to it's own issues but does not replicate the type of actions malware would perform.

--No vulnerability needed : The majority of malware is coming in via phishing using email and browsers. A lot of these are not even attempting to take advantages of vulnerabilities but instead takes advantage of humans lack of knowledge in the space. This can be replicated to some degree in social engineering tests but malware has a wider spread on the number of techniques used than most SE testing platforms.

--Targets : A lot of times pentests want to try to compromise server to get at some company data. Malware may take this approach but a lot of malware such as banking trojans and bots are attacking people through the browser and taking control of things like bank accounts and trusted logins.

--Handling and Response : The way you handle a malware based infection could be very different than a hacker infiltrating your network. Malware is really good about getting itself planted in many ways on a system where most hacker types try to leave little footprints.


http://www.verizonenterprise.com/DBIR/2013/
https://www2.trustwave.com/2013GSR.html


http://upx.sourceforge.net/
https://www.lookout.com/resources/reports/state-of-mobile-security-2012
http://www.tenable.com/blog/detecting-known-malware-processes-using-nessus


These are the types of test we came up with. You may have more you could consider in your network but these where just the starter ones to consider.


One basic component of this is just training people how to deal with malware and the tools they would use to work with malware. Performing controlled test, reading some of the malware books such as malware analyst cookbook and doing the exercises or just taking live malware and doing analysis against it.


Egg hunting can allow you to setup a scenario in smaller controlled conditions and see if your staff can handle even some basic items. For example setup 3 boxes and infect one and see if they can detect what is infected.
This is a good way to perform future tests against up coming threats as well. Install the latest thread on one of the 3 boxes and then have your staff find out what it is, you can then determine how they found it and script that to fit a large scale environment.


Test your IR team to make sure they are reacting to malware correctly. I have seen many IR teams thought of malware response is to run AV or re-image. They treat malware more like hassle instead of a threat. This is a good way to make sure they are investigating infections and they are then working with them as they should.


This one is my personal favorite. Write a controlled specific piece of software that replicated malware like actions but is really benign. I give an example of this later in the talk.
The idea here is to infect a system on your live network with this controlled testing pseudo malware.

-- You can use this sort of test to see if your monitoring is working

-- Determine what tools do you have that are helping detect infection.

-- Give your people constantly something to look for. This could even get turned into an incentive based system where if someone finds the fake malware they get a gift card or day off or whatever management decides. Just never tell them when the test is going on so the thought of something being out there to find is always there.


Here I would like to introduce you to some techniques and places you can look into to start your testing. These are items that are typical of malware and can be replicated in ways that won't always be harmful or malicious.


Persistence is one of the core components of a piece of malware. If it can't persist it can't cont to steal information, money, or use your resources. There are some tools such as autoruns.exe you can use to find some of the most common locations to test but I have been able to find many many more locations to persist at.
Some testing ideas :

-- name a benign piece of software something like malware.exe and set it up in one of the persistence locations.

-- Build a browser extension that does something malicious. Firefox and Chrome are currently not monitored by any of the persistence detection programs like autoruns.exe, gmer, hijack this, or any of the other tools that do this. This is a way to persist that takes manual work to detect.


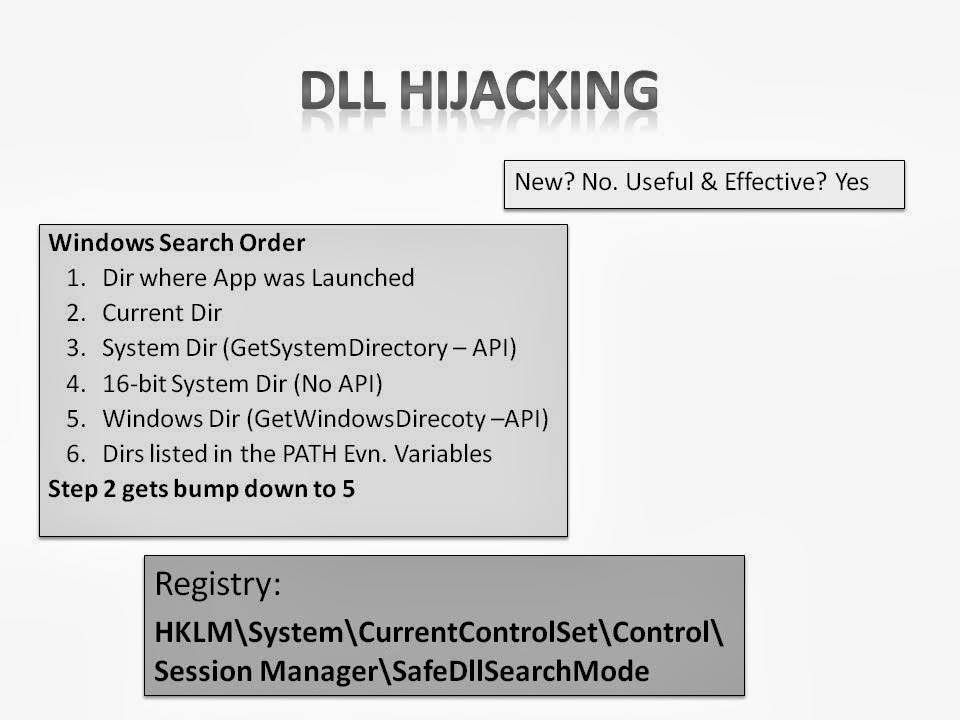
One major form of persistence is dll hijacking. This is a great persistence technique as long as you know a specific application you can use to leverage this technique.

http://securityxploded.com/dllhijackauditor.php
http://vimeo.com/14391242


Rootkits are a core component to malware. They allow attacker to take so much control over a system they can prevent you from even being able to see they are working in any form. This is something that is extremely hard to detect over a network and the longer it exists the harder it gets to detect because all markers of the infections start to just become part of the noise.
Developing a basic rootkit or using some source from one of the books shown here can allow you to refine detection techniques and understand how rootkits looks on a system.


Process Hollowing and Process Injection are ways to hide what is bad in something good. This is used very very often and setting up simple dll injection scenarios so you can find ways to identify infected processes would be a great place to look.
http://blog.spiderlabs.com/2011/05/analyzing-malware-hollow-processes.html


Most malware leaves behind footprints that are unique but hard to automate detection. You can replicate this kind of behavior without having to be malicious.
For example :

-- Create a running process tree that doesn't make sense. For example cmd.exe running under svchost.

-- Create odd names like xyxjz.exe. Malware will drop unique names to prevent AV from using just it's name as a detection technique. This leaves it harder for AV but easier for humans to determine this.

-- Create a processes with missing icons. Something may be named iexplorer but miss the internet explorer icon.

-- Create a process from something like %TEMP% directory. This shows a processes running from an odd directory location.

-- Create a process running from a weird session id. For example cmd.exe should not be running as sid 0 normally.

-- Create an application and compile it using the name malware.exe then rename it to something simple like services.exe. The original file name is detectable in some cases and can be a sign of a suspect application.


Malware will often try to normalize it's traffic to make it not too detectable by network based detection systems. Even though they try this it is hard to export data in some forms and just make it look like http. Also if it hard to talk to systems you are not supposed to and not look suspect.
Replicate suspect traffic
for example

-- Connect to an irc server and receive some off commands such as just integers or just one word communication.

-- Have cmd.exe start talking http to a place like dyndns

-- Have a system connect attempt to connect to you DC every 30 seconds with a random incorrect login.


Here are some simple locations that can replicate malware type attacks or are currently used in malware that you can use for testing.


Metasploit is a very obvious and supplies you with a large number of testing items in a simple format. You already have your command and control server, the metasploit engine, and payloads you can use as the infection.
I also want to mention SET here as well. I really should have included this in the slides as it has some phishing items that really help facilitate this type of test.


Use malware... There are a few good dumps of major malware kits. These are easy to find and have large amounts of code you can grab and use to build your own samples.
Do not strait copy and paste from these dumps, some may have backdoors. 


RATS or Remote Administrative Tools are used by malware in any low end pieces of malware. You can use these but I would suggest against using them in live environments because of some of the risks.


This is really my highest suggestion. Develop your own test items. This might seem like something very hard to do and might be dismissed at start but I think here I can make a case why this is much easier than you expect.

-- You don't have to worry about evasion technique or some complicated controls. You are not developing malware, you are developing testing software that looks like malware.

-- You don't have to use something like ASM or C unless you are working on a rootkit. I have ran by many samples that are python compiled using py2exe, vbscript, powershell, c#

-- If you are a corporation you probably have programmers. Malware is just a program and your programmers might not know it but they can probably write a large portion of the malware out there. Instead of asking them to produce a piece of test malware ask them to do what you want it to do. For example say this...
"Can you write something for me that downloads a executable from a public site then drops it in X directorys. I want it to start on boot using this reg key or file location and then I would like for it to call these API calls. After a while can you have it send test this data to this server."
This is something that not only are you getting samples to test against but you also are getting another point of contact in your network for malware knowledge.


Books, a lot of the books listed above and in the previous locations have example code and knowledge you can use to perform these tests.


Juan and I (myne-us) have a little malware kit we are developing from scratch. This is something that helps our knowledge but also puts us in the seat of the malware developers to understand a lot of the challenges.
We are still not sure what we are going to do with this kit or what we will release.
When I was doing the talk at Derbycon I had someone ask me why I didn't want to release this public like a lot of other tools out there. I told them about some of my concerns with some AV bypass techniques and some code I am using that comes from fairly advanced techniques that could easily be used. I do want to add to this... I don't care what others do and I don't make my decisions based on if someone else would do it. Because of this we will make some decisions based on our look in on this and when we do we will try to make it useful but not harmful.
Eventually I would like to start a website that I can put some of these concepts as a total into. This takes time and that is what is really preventing me from getting it rolling now.


This is just a simple idea of something that you can use for testing. This is a good first step test that is not all that complicated and can be done in a short period of time.
One thing I would suggest in live tests is to try to replicate some infection vectors such as phishing, exploits, or something that allows it to get on a system. I would not spend a lot of time on this because this is what pentests and SE tests test but it if good to leave the footprint for detection purposes. Remember you want to improve your detection not just cause your staff to get mixed up.


Phishing email comes in


website is hosted on google sites and asks for JRE update. The download link leads to a dropbox download.


side note : This just shows that you can simply pack the payloads using CFF explorer's UPX packer option to help replicate the look of malware.

Once the malware runs it simple state JAva JRE 7 updated. Someone made a good point that there is no asktoolbar install option :) or 3billion vulnerable people using page.  This is something you may want to replicate.


When the above "java updater.exe" ran it dropped a iexplorer.exe binary in TEMP.


It also setup for the binary to start on login using the standard
HKCU\SOFTWARE\MICROSOFT\CURRENTVERSION\RUN reg key


The iexplorer.exe binary itself replicates some actions of a piece of malware but does it in a benign way.
It starts a SetWindowsHookex() shim on the keyboard but never attempts to attach to any other process to sniff. It will just sniff the keyboard from the local processes leaving it useless but still replicating a keylogger.
It then every X seconds writes out to a file some data that looks like a keylogged session. For example a login to gmail, domain creds login, or some browser activity. It then sends this data up to a website. I just used my own when I developed this but you may want to send the data to some fast flux style DNS address.


Post any questions here in the comments and I will try to address them if possible.

Code from this talk will be posted after I do some cleanup and make sure there are no issues with what I am posting.


After I posted this a friend of mine linked me to a topic similar to this topic and shows some data points that are really interesting and a talk worth watching.
http://vimeo.com/31548167
https://www.isecpartners.com/media/12955/eip-final.pdf

Saturday, August 25, 2012

Reverse Engineering Powershell cmdlets


Powershell is a commandline interface into the .net framework for Windows. So the majority of reversing powershell is just getting an understanding on how to access the .net code base and decompiling it into readable format. When I started looking up on how to do this most of the posts where not on how to reverse powershell but how to make powershell run in c#. This post is going to explain how to take a powershell cmdlet and get back to the .net code.

This is extremely simple, so simple I was surprised that there where no posts about this. Basically you need to know 2 commands in powershell and use a .net decompiler.
Trace-command
Get-Command
.net reflector

Get-Command will show the dll that holds the cmdlet
 PS C:\> Get-Command Get-Process | fl DLL  
 C:\Windows\assembly\GAC_MSIL\Microsoft.PowerShell.Commands.Management\1.0.0.0__31bf3856ad364e35\Microsoft.PowerShell.Commands.Management.dll  

Trace-Command will show the method call used in the dll
 PS C:\> Trace-Command -name cmdlet,ETS -PSHost -Option executionflow -Command Get-Process notepad  
 DEBUG: Cmdlet Information: 0 : Constructor Enter Ctor Microsoft.PowerShell.Commands.GetProcessCommand: 37470457  
 DEBUG: Cmdlet Information: 0 : Constructor Leave Ctor Microsoft.PowerShell.Commands.GetProcessCommand: 37470457  
 DEBUG: ETS Information: 0 : Method   Enter PSObject..ctor():object = Microsoft.PowerShell.Commands.GetProcessCommand  
 DEBUG: ETS Information: 0 : Method   Leave PSObject..ctor()  
 DEBUG: ETS Information: 0 : Method   Enter PSObject..ctor():object = System.Diagnostics.Process (notepad)  
 DEBUG: ETS Information: 0 : Method   Leave PSObject..ctor()  
 Handles NPM(K)  PM(K)   WS(K) VM(M)  CPU(s)   Id  ProcessName  
 ------- ------  -----   ----- -----  ------   --  -----------  
    62    8      3136    7548  76     7.61     784 notepad  

As you can see above the cmdlet called is Microsoft.PowerShell.Commands.GetProcessCommand . All we need to do now is open .net reflector, attach to the dll, and go to that method call to see the source code.


Here is a good link to learn how to write (and read) cmdlets and allow you to reverse the cmdlet.
http://www.codeproject.com/Articles/32999/How-to-Write-a-Custom-PowerShell-Cmdlet-Part-I

Monday, January 23, 2012

Question: How does loader know ASLR is enabled for a binary?

Most people know that ASLR randomizes the base address of the binary when loaded, but how does the loader know that a binary is ASLR capable? This is a fairly easy question to answer but from what I can tell is rarely documented as a detection method and the subject of this post.

In the PEHeader->IMAGE_OPTIONAL_HEADER there is a flag called DLLCharacteristics that defines many features for the executable on load, 1 of them being ASLR. If you look here IMAGE_OPTIONAL_HEADER structure and scroll down about mid way you will see the values it defines. If you look you will also notice this defines if DEP is enabled as well.

I created a little ruby script to give you access to these values over your whole file system, directories, or a file. There are many tools like cff explorer you can use to view these per a file but this one will give you the ability to crawl a file system to find multiple files with ASLR disabled, DEP disabled and more.

git dllcharacteristics

enjoy

Thursday, January 19, 2012

QnA -> What is FS

Q: What is FS?

I wrote a challenge some time back on Securabit podcast I am a part of as a fun exercise. The question came from someone trying to reverse this challenge.
The anti-debugging technique was accessing the PEB offset +68 to detect if the debugger is attached. This is set to 70 when a debugger is attached. To find the base address of PEB I accessed FS[30] and stored that in a register.
Ok I skimmed over some items there like why is it set to 70 and what is the PEB but that is not the question. The question is what is FS.?

FS is a segment register that was added with the release of protected x86 32bit operating systems. Typically, in win32, FS points to the base of the Thread Information Block of the current active thread in PEs.

To break this down even more when you see commands such as
mov EBX, DWORD PTR DS[EAX]

the DWORD pointer is saying start with base address of DS (another segment register) and add the value EAX to this and store that in EBX. so when I accessed
mov EAX, DWORD PTR FS[30]

I was saying take the value in FS and add 30 to that and return what is there. This address stores the Base of the PEB.

Few other notes on FS:
FS[0] stores the pointer to the first SEH in the link list. This is usually called when an exception occurs in code.

FS points to the current active thread. This means a single application with multiple threads will have multiple pointers to different Thread Blocks.

Challenge
Source for Challenge

Saturday, February 5, 2011

When fuzzers miss (REVISED), Derbycon talk.

This post has been revised to reflect my talk at Derbycon on when fuzzers miss. I expanded on the explanations, added 2 more examples, code, slides and videos of each demo.

Each demo source and executable is in a zip below the corresponding video.

Link to derbycon talk


Fuzzing

Expansion fuzzing, this is the most common form of fuzzing. This is where you take a buffer and push characters inside of it slowly expanding the number of characters you push. This is to find overflows in improper bounds checking in it's simplest form.

Expansion fuzzing example:
 #!/bin/python
 from socket import *
 import sys

 if len(sys.argv) < 2:
  print "Usage: app.py ip port"

 ip = sys.argv[1]
 port = sys.argv[2]

 s = socket(AF_INET, SOCK_STREAM)
 s.connect((ip, int(port)))
 s.settimeout(2)

 for i in range(30000):
  try:
   s.send("A" * i)
   data = s.recv(1024)
   if data.chomp != "":
    print data
  except:
   pass
 s.close

Smarter:
Some fuzzers are a little more intelligent about how they handle the fuzzing process. They will take into account int wraps, special characters used in the protocol among many other things. These are fuzzers such as listed below as a small example
Spike, sully, ....

Brute force fuzzing:
Brute force is a time/accuracy trade off fuzzing. This is a technique where you try to push every variation of every character into a buffer possibly finding parsing issues or read issues. The below example is raw brute force buzzing and can take forever, it is suggested to be smart about input and not try to run this raw against a target unless you have a ton of processing power and time.

Brute force fuzzing example:
 import sys, time
 from socket import *

 class bruteforce:
  def __init__(self, ip, port):
   self.ipaddr = ip
   self.port = port

  def fuzz(self, val):
   try:
    s = socket(AF_INET, SOCK_STREAM)
    s.connect((self.ipaddr,int(self.port)))
    # Timeout for any hanging sockets
    s.settimeout(1) 
    s.send(val)
   except:
    # When fail print the characters 
    # failed to screen in hex format
    print "failed on value: "+val.encode('hex') 
   s.close
   return 0

  def run(self):
   size = 2**100000
   i = 0
   # have to use while because the size 
   # is too large to be handled in a for loop
   while i < size: 
    # convert int to hex
    val = hex(i).replace('0x', "") 
    if len(val)%2:
     # align the hex to make sure 
     # it is set to decode
     val = "0" + val 
    # decode the hex to a character
    data = val.decode('hex')
    
    self.fuzz(data)
    i += 1
    # setup timing for app so you don't 
    # flood it and fail on packets
    time.sleep(.01)     
   return 0


 if len(sys.argv) < 2:
  print "usage: brute_fuzz.py ip port"
  exit()

 # !!Warning before running this!!
 # if this prints the characters to the
 # screen it will lock up whatever prints the characters!
 # Operating systems do not like beep 
 # codes and this will flood it with beepcodes and stall

 fz = bruteforce(sys.argv[1], sys.argv[2])
 fz.run()

Listed Commands:
listing out commands that might be common exploit techniques specific for a protocol and running those quickly against a target.


This is my thought process in exploitation.
Reading:
I can not stress how important this is! Reading the application documentation, protocol RFC, and any files that get accessed by the application.
Discovery / vuln to exploit
this is a phase most of what this talk is based on so will not go over this at this point.
Technique:
this is where you get to where your shellcode is located once you have a POC running and offsets figured out.
Shellcode:
writing custom shellcode or using existing shellcode
Cleanup:
important process that can easily be skipped. review your exploit and make sure there are no bugs and see if there is anyplace you can reduce code.


This is a very simple exploit as an example to show where the vuln is located. The bottom left is the source code, the top left is the function for int overflowme() and on the right is the stack frame for overflowme(). this is what the stack looks like at point when EIP points to the call to gets.


In this slide we see the progression of the vulnerability. This shows when EIP is pointing to RETN and ready for the exploit to kick off. The conect of vulnerability vs the time the exploit kicks off is one of the keys behind this talk and is something throughout the slides I kept a theme to color all the vulnerable places in pink and the places where the exploit kicks off in red.


Time for the demos!
In each of these demos you will see bubbles the represent a function and arrows that show the order of calls and returns. if an arrow is pointing down it is a call to another function and if it is pointing up it returns back to that function. Keep an eye on the text colors as well pink = vulnerable place , red = where the exploit kicks off and what we want. Also keep in mind when something is pushed on the stack it will push up the function chain overwriting the stack frame from the higher function not the lower functions.


This is a post I made some time back that I merged into this post.


In this example we see that a char variable is set in StartProgram with a buffer size of 25. inside this function it calls get_login and prompts for a username and password. The vulnerability is in the username where it attempts to fill a 25 byte buffer with a 50 character input. This is a classic buffer overflow where EIP will be overwritten with whatever is pushed in the buffer. The trick to why a fuzzer will miss this is RETN is where the vulnerability is but it always stays in 1 function lower then where we work in unless we successfully log in.


demo1.zip


By finishing out the application and tearing down each stack frame we where now able to trigger our exploit.

Watch the stack when inputting data into a buffer, you should always follow the data you input in a buffer.


Threads can be really troublesome in exploit development. The only thread that really matters is the main thread that the application is running in. Any other thread can be destroyed at any period in time and no effect the application. This key problem will leave us with a vulnerability hanging out there without triggering the place the exploit kicks off.

We will also look at stacks and variables to show that when you overflow a buffer you are not just overwriting RETN address but also the data from other local vars below it and how this can cause issues.


In this example we have a single thread that opens off of startApp then calls authenticate to get the username and password. I have "main thread" shown next to the branching thread just to represent the fact that there are 2 threads running at that point. The vulnerability is in the password field allows 200 byte character set to be pushed into a 20 byte buffer and the exploit kicks off when this function returns. The key here is looking at verifyAuth and seeing when auth fails it just kills that thread and opens a new one with startApp(). To get this exploit to kick off we need to be able to successfully log in to break down the function block for veryfyAuth -> authenticate.

In the video I will also show examples where authenticate fails to auth because we stomp on the username on the stack causing the auth process to fail. This is another key that will cause you sometimes to hit the incorrect path to let an exploit trigger by just pushing As into the buffer without knowing what that buffer holds.

Demo2 Part1


Demo2 Part2


This can be tricky to find but taking the normal logic of following the data should allow you to see the overflow happen. From this point it is just looking at where the thread is terminated and trying to find a way to get it to start returning higher up the stack frames.

Also as shown in the video the location that the buffers get filled cause the overflow to stomp on a local variable before it. Paying attention to what buffer is for what can sometimes be challenging when following process. Setting a memory or hardware breakpoint on access to stack frames can sometimes help find this but most time this is just going to be manual work of watching where the buffers are located. One key thing to note here is the fact that if this where a pointer pushed onto the stack and not a variable you not may have control over execution in the future, so watch those local variables and overwrite to see if they may be used in a future path.


In this example we will start a look into the heap and something fairly obvious but often used exit(). The heap can often be a great place to show many examples of where fuzzers just fail at finding the exploitable areas. Most of the protections on the heap do not target the allocation but the free calls to the chunks. Just like RETN this has to do with watching for the place where the exploit kicks off and not watching the vulnerable call. Heap can have a lot of examples and location where the exploit kicks off so this makes things more difficult, in a use after free example we have to look for the use then an allocation in the future, in a double free we need to make sure we are looking for that second free and taking the correct path to make sure we are getting to it just to name a few.


In this example we will look at crashing an application using a standard heap overflow and a free to cause a crash when validating the free list. This application is a simple echo program, all it does is echo out anything you send it. After the first echo it will ask if you would like to keep echoing output, if Y then it will allocate the initial echo to heap using heapalloc and then continue to echo out in a while 1 loop anything you put in. the trick here to access free is to get out of the echo loop free the heapalloc and exit the application. To access free you need to type quit() which is not told to you. I put the hidden quit in because reversing and finding pathing such as this sometimes can help you get back where you need to be.

[video] !!!Video is on my desktop and have not put time into edit it, it will be here someday!!!
demo3.zip


heap is more difficult in every way then stack overflows including finding flaws so some practice and thinking on where the exploit kicks off with practice will help find heap exploits


These are only a few examples of limitless possible reasons why buffers may have an overflow and not trigger the exception. The main thing to take form this is the thought process.


Here are some things I use to find exploits such as this.
- when pushing data into an application pay attention to functions and understanding how this would look like in C. If you want to find the exploitable area and not just the vuln follow the data.
-break/log RETN, Watch the call stack/ pathing/ stack frame. Also if program is threaded make sure to check all stack frames and not just the current thread's stackframe.
-break/log Free/alloc, When watching for heap exploit break on what controls the heap structure and dump the heap chunks
-all references to, find anything that references the data you pushed in to see if it is used someplace later in a strcat, strcpy or anything of this type
-diffing, if the program is already patched don't take the time finding the exploit when they give it to you in a diff
-all intermodule calls, use all call function calls to find where you may want to look and pull out specific stack frames looking for user controlled data
-tracing, this can take a ton of time but tracing application paths and finding areas you are not hitting looking for data to be accessed can help.
-Work!, this is not all easy so it is going to take some thinking and some of your own ideas.


if you have any questions or comments please post below, hit me up on twitter or irc